
Main Facts
The landscape of social media marketing has undergone a fundamental structural shift. For years, the metric that dictated digital status on Instagram was the raw follower count—a conspicuous display of digital real estate. Today, however, that paradigm has dissolved. Businesses seeking to partner with creators or evaluate brand presence no longer care solely about how many followers an account commands. Instead, modern influencer marketing and brand strategy demand a granular understanding of audience quality, engagement trajectories, and thematic alignment.
Sustainable growth on Instagram is no longer achieved through short-term algorithmic hacks or viral flash-in-the-pan campaigns. Rather, it requires a disciplined, analytical approach grounded in consistent content creation, active community engagement, and rigorous data monitoring. While follower growth still plays a critical role in establishing brand credibility and profile discoverability, it is merely the tip of the data iceberg. True account health is revealed only when net follower acquisition is evaluated alongside reach, engagement rates, profile-to-follow conversion, and long-term audience retention.
Chronology and Evolution of Instagram Analytics
To understand how modern Instagram analytics operate, it is necessary to examine how tracking practices have evolved over time:
- The Era of Pure Vanity (Pre-2018): Marketers and creators focused heavily on gross follower counts and automated growth pods. Quality was largely ignored, leading to inflated profiles with high follower numbers but near-zero real engagement.
- The Rise of Engagement Rates (2018–2021): As algorithms matured and brands grew wise to fake followers, the industry pivoted toward engagement rates (likes and comments divided by followers) as the primary litmus test for influencer value.
- The Holistic Data Framework (2022–Present): Today, advanced analytics encompass a multi-layered matrix. Brands examine reach, saves, shares, profile visits, watch time, and net follower growth. Analytical workflows now require historical comparisons, weekly and monthly tracking routines, and an understanding of first-party versus public data sources.
Supporting Data and Essential Metrics
Relying on a single metric is a recipe for strategic failure. To construct a clear picture of account performance, marketers must evaluate a comprehensive suite of indicators.
Core Metrics and Their Meanings
| Metric | What It Actually Tells You |
|---|---|
| New Followers | The gross number of accounts that followed during the reporting period. |
| Unfollows | How many followers left; must be interpreted alongside campaigns and normal audience churn. |
| Net Follower Growth | New followers minus unfollows, showing overall audience expansion or contraction. |
| Follower Growth Rate | Net follower growth expressed as a percentage of audience size at the start of the period. |
| Reach | The number of unique accounts that saw the content. |
| Engagement Rate | The percentage of reached users or followers who interacted with the content. |
| Profile Visits | The number of times users visited the profile after encountering content. |
| Saves | A signal that users considered the content useful enough to revisit. |
| Shares | A signal that users considered the content relevant enough to distribute to others. |
| Profile-to-Follow Conversion | The percentage of profile visitors who became followers during the reporting period. |
Objective-Based Performance Indicators
Different business goals demand entirely different primary and supporting metrics:
| Goal | Primary Metric | Supporting Metrics |
|---|---|---|
| Brand Awareness | Reach | Views, shares, profile visits |
| Community Growth | Net Follower Growth | Growth rate, profile-to-follow conversion, engagement rate |
| Product Promotion | Attributed Conversions / Revenue | Link clicks, profile visits, conversion rate |
| Influencer Partnerships | Campaign Result Tied to Objective | Qualified reach, engagement rate, audience quality, cost per result |
| Content Optimization | Engagement Rate by Reach | Saves, shares, watch time, profile visits |
Comparative Case Study: Translating Data into Insights
Consider an illustrative comparison of two consecutive 30-day reporting periods for a growing brand account:
- Followers at Start: 10,000 (Previous) vs. 10,300 (Current)
- New Followers: 500 vs. 900
- Unfollows: 200 vs. 250
- Net Follower Growth: 300 vs. 650
- Follower Growth Rate: 3% vs. 6.3%
- Reach: 50,000 vs. 72,000
- Saves: 300 vs. 480
- Engagement Rate by Reach: 4.1% vs. 5.2%
This data proves that the account’s expansion was not an isolated spike in follower acquisition; reach, saves, and engagement rose in tandem. However, analytics alone only identify when performance changed. Content and campaign logs are required to explain why it changed—whether due to a shift in publishing frequency, targeted collaborations, or algorithmic favorability.
Official Industry Perspectives and Expert Insights
Industry professionals emphasize that sustainable Instagram growth is rooted in disciplined operational habits rather than emotional reactions to daily fluctuations.
According to analytics and content strategists, the most common trap creators fall into is panicking over minor, short-term dips in follower counts. Nadica Naceva, content specialist and editor, notes that effective analysis requires patience and a structured reporting routine. "A single week of declining numbers does not mean your entire strategy has failed," industry experts advise. "True analysis requires looking at weekly, monthly, and quarterly trends to separate normal platform churn from strategic missteps."
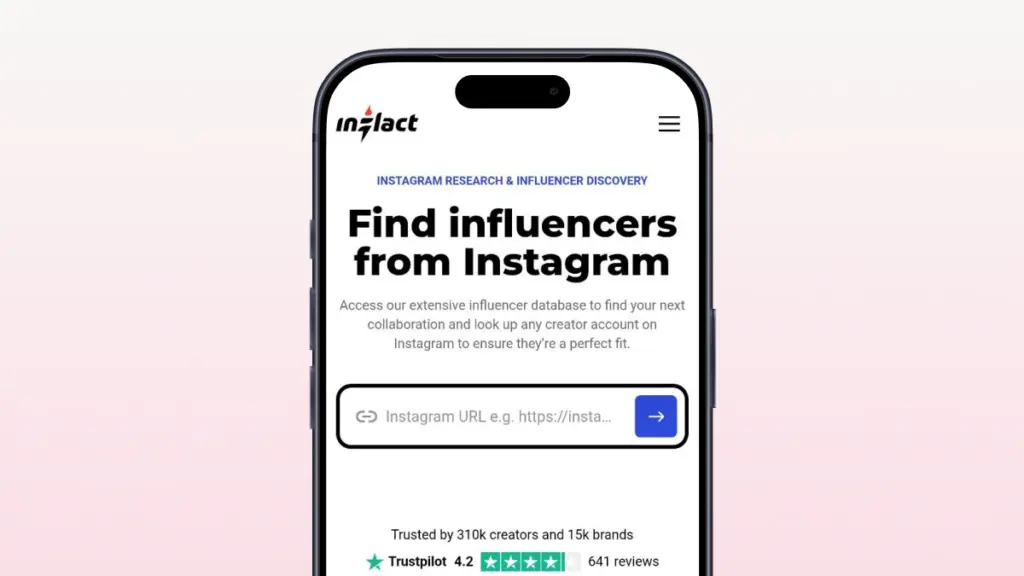
Furthermore, professional marketers stress the distinction between public data and first-party analytics. While public follower trackers are useful for competitive intelligence, first-party campaign reporting must be pulled directly from native platform insights or authorized dashboard integrations to ensure accuracy.
Implications for Creators, Brands, and Marketers
The transformation of Instagram analytics carries profound implications for everyone operating within the digital ecosystem.
For Influencers and Creators
Creators can no longer rely on aesthetic feeds and inflated follower numbers to secure brand deals. To remain competitive, creators must master their backend analytics, demonstrating high audience retention, robust save-and-share ratios, and steady net growth rates. Content must be purposefully engineered—educational carousels to drive saves and Reels to maximize reach—rather than posted blindly in the hope of catching a viral wave.
For Brands and Agencies
Brands vetting influencer partners must look past the vanity numbers. An account with 500,000 followers and a 0.5% engagement rate offers far less value than a micro-influencer with 25,000 highly engaged followers whose audience aligns precisely with the brand’s target demographic. Implementing a structured reporting workflow ensures that marketing budgets are allocated toward verified, high-performing partnerships that drive tangible business outcomes rather than empty impressions.
Strategic Recommendations for Sustainable Growth
To build a resilient Instagram presence, stakeholders should implement the following best practices:
- Maintain Consistent Reporting Schedules: Balance daily check-ins (for immediate content triage) with weekly, monthly, and quarterly reviews.
- Standardize Calculations: Use consistent formulas for growth rates and engagement denominators across every reporting period.
- Annotate Major Changes: Keep a comprehensive log of content adjustments, ad spend, giveaways, and algorithm updates to contextualize data shifts.
- Prioritize Value Over Metrics: Focus on creating authentic connections and delivering utility to the audience, allowing metrics to reflect organic brand loyalty.