
In an era defined by rapid technological shifts, geopolitical realignment, and fluctuating public sentiment, the accuracy of data has never been more critical. As researchers and policymakers seek to understand the pulse of global society, the rigor behind data collection becomes the foundation upon which policy is built. Pew Research Center, a non-partisan "fact tank," recently released the methodological framework for its 2026 research initiatives, providing an unprecedented look into how the organization captures the complexities of human opinion.
This report explores the architectural integrity of the Spring 2026 Global Attitudes Survey and the American Trends Panel (ATP), detailing the meticulous processes—from demographic standardization to sophisticated weighting—that ensure these findings remain the gold standard for social science research.

Main Facts: The Pillars of Rigorous Inquiry
The 2026 research cycle is characterized by a multi-modal approach designed to bridge the digital divide and ensure cross-cultural comparability. The primary goal of these surveys is to provide an objective, data-driven map of public sentiment on topics ranging from the evolution of artificial intelligence to the perceived stability of democratic institutions.
At the heart of these efforts is a hybrid collection model. Recognizing that global internet penetration and telephone access vary wildly, Pew employs a mix of telephone, face-to-face, and online interviews. This diversity in collection is orchestrated by industry leaders including Gallup, Langer Research Associates, and the Social Research Centre. By relying on national samples, the Center ensures that the findings are not merely anecdotal but representative of the broad, diverse populations they study.
To maintain consistency across borders, the Center employs standardized demographic variables. For instance, educational attainment is categorized using the United Nations’ International Standard Classification of Education (ISCED). Similarly, economic stratification is determined by World Bank classifications, which group countries into high- and middle-income brackets based on per capita gross national income. This standardized approach allows for the meaningful comparison of attitudes between a citizen in a G7 nation and one in a developing economy.
Chronology: A Two-Wave Approach to 2026
The American Trends Panel (ATP) provides a longitudinal window into the American psyche. In 2026, the focus centered on two pivotal waves—Wave 187 and Wave 195—each designed to capture shifting public opinion during distinct seasonal contexts.
Wave 187: The February Snapshot
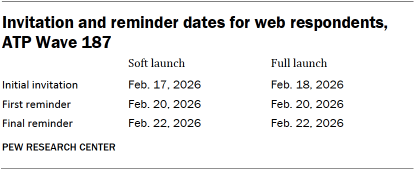
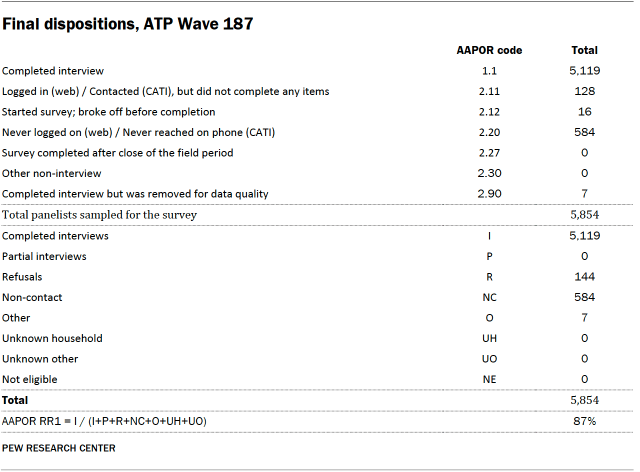
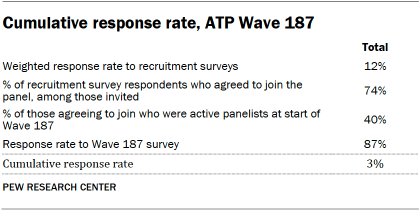
Conducted between February 17 and February 23, 2026, Wave 187 served as a foundational data point for the year. The process began with a "soft launch" on February 17, involving 60 panelists, to ensure that the digital interface and logic flow were functioning without error. Following this, the full launch commenced on February 18. This wave saw a robust response from 5,119 panelists out of 5,854 sampled, achieving an impressive survey-level response rate of 87%.
Wave 195: The June Update
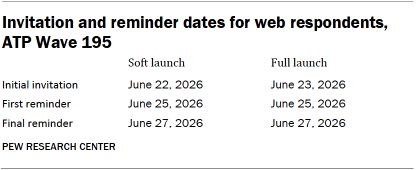
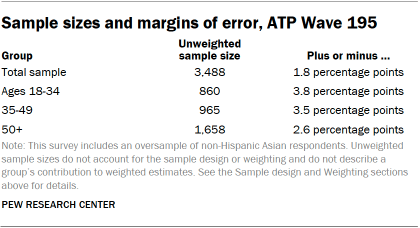
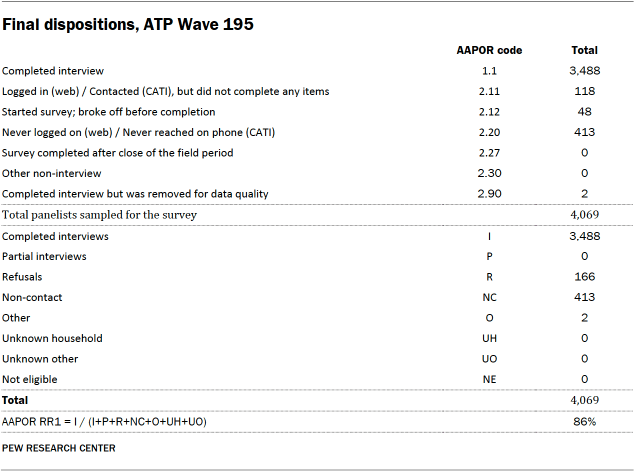
As the year progressed, Wave 195 was launched to capture mid-year sentiments, running from June 22 to June 28, 2026. Similar to the previous wave, a soft launch was conducted on June 22, followed by a full rollout the next day. This wave yielded 3,488 responses from a sample of 4,069, maintaining a high response rate of 86%.
The temporal separation between these two waves allows the Center to measure the stability of opinions over time and evaluate how specific events during the intervening months may have influenced public perception.
Supporting Data: Ensuring Precision and Representation
One of the most complex challenges in modern polling is mitigating the bias inherent in voluntary participation. To counter this, Pew employs a sophisticated suite of statistical techniques.
The Science of Oversampling
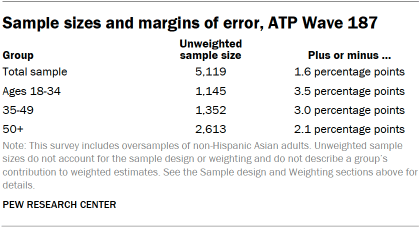
In both waves of the ATP, the Center utilized oversampling, specifically targeting non-Hispanic Asian adults. While this group represents a smaller percentage of the total U.S. population, the decision to oversample ensures that the margin of error for this subgroup is minimized. These oversampled groups are subsequently weighted back to reflect their true proportions in the general population, preventing any demographic skew.
Data Quality and Integrity
The integrity of the data is protected by rigorous quality control measures. Researchers monitor for "satisficing"—a behavior where respondents provide lazy or rushed answers, such as selecting the first or last option on every question or leaving significant portions of the survey blank. In Wave 187, seven respondents were disqualified for such patterns; in Wave 195, two were removed. This pruning ensures that the final dataset is composed of attentive, engaged participants.
Weighting and Calibration
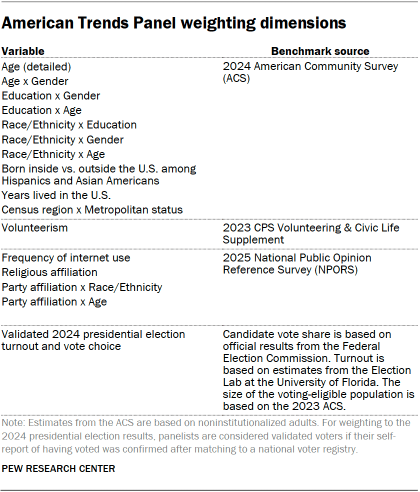
The final data is subjected to a multi-stage weighting process. Each panelist is assigned a base weight derived from their probability of being recruited into the panel. This weight is then recalibrated to align with U.S. Census Bureau population benchmarks. This process accounts for non-response and panel attrition, ensuring that the final output mirrors the sociodemographic reality of the country.
Official Responses: The Methodology of Recruitment
The methodology behind the ATP’s recruitment is as critical as the survey itself. Since 2018, the Center has moved toward Address-Based Sampling (ABS). This process involves sending physical mailers—complete with study cover letters and pre-incentives—to a stratified, random sample of households selected from the U.S. Postal Service’s Computerized Delivery Sequence File.
This file is estimated to cover between 90% and 98% of the American population, providing a far more inclusive sample frame than traditional landline-only approaches. Within each selected household, the "next birthday" method is used to randomize which adult completes the survey, further reducing selection bias.
The Center also acknowledges that certain demographic groups are traditionally harder to reach. To address this, they employ differential incentives. Depending on the survey and the demographic group, post-paid incentives—in the form of checks or digital gift cards for major retailers—range from $5 to $20. This financial acknowledgment serves to incentivize participation among groups that might otherwise be underrepresented, thereby enhancing the overall accuracy of the panel.
Implications: Why Methodology Matters
The implications of these rigorous methodological standards extend far beyond the pages of a research report. In an era where "fake news" and algorithmic echo chambers can distort public discourse, the existence of reliable, transparent, and scientifically sound data serves as a vital anchor for democracy.
By providing a granular look at how ideology, education, and economic status intersect with public opinion, Pew Research Center enables stakeholders—including journalists, legislators, and the public—to move beyond partisan narratives. The ability to see, for example, how educational attainment affects one’s views on global trade or national identity provides the necessary context to navigate a polarized society.
Furthermore, the transparency of this methodology—making the weighting dimensions, response rates, and data quality protocols public—is a testament to the Center’s commitment to accountability. It allows peer researchers to audit their findings, fostering a culture of continuous improvement in the social sciences.
As the 2026 data continues to be disseminated, the behind-the-scenes effort described here serves as a reminder that meaningful insights are not found in headlines, but in the meticulous, often invisible labor of sampling, weighting, and validating. Whether measuring the world’s view of artificial intelligence or the American public’s satisfaction with their democracy, the quality of the answer is inextricably linked to the quality of the method. For those seeking to understand the trajectory of our global society, these 2026 surveys provide not just data, but a roadmap for informed engagement in the years to come.