

In an era defined by data-driven decision-making, the integrity, transparency, and accuracy of public opinion research carry immense weight. How do researchers capture the shifting sentiment of an entire nation? What protocols ensure that the voices of marginalized communities are not drowned out by larger demographics?
These questions find their answers in the rigorous methodologies employed by premier research institutions. This report provides an in-depth examination of the methodological framework behind Wave 181 of the American Trends Panel (ATP), conducted by the Pew Research Center in partnership with SSRS. Fielded in October 2025, this specific wave focused heavily on complex cultural and economic sentiments—most notably exploring what the American dream means to diverse communities across the United States, with a distinct focus on Latino experiences.
To properly contextualize the findings of such a comprehensive national study, one must understand the intricate mechanics of its execution: from address-based sampling and multi-tiered weighting to cutting-edge artificial intelligence integration in qualitative text coding.
Main Facts: Wave 181 at a Glance
Wave 181 stands as a testament to modern demographic research, combining traditional panel surveying with advanced digital and analytical tools.

- Field Dates: The survey was actively fielded from October 6 to October 16, 2025.
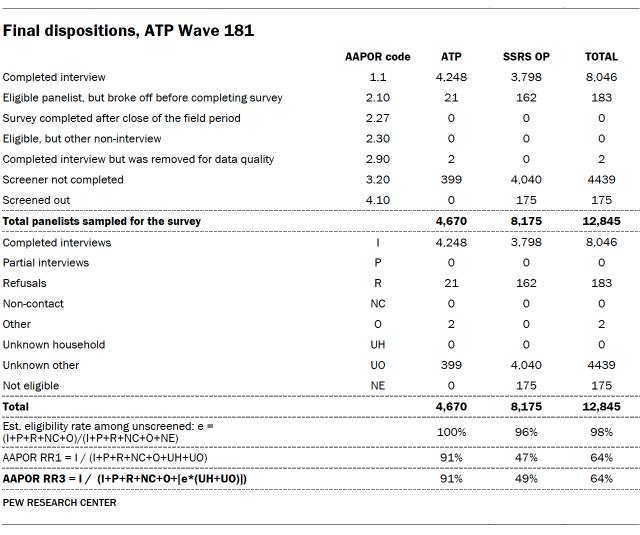
- Total Sample Size: A robust total of 8,046 panelists completed the survey out of 12,845 sampled, yielding a survey-level response rate of 64% (AAPOR RR3).
- Sample Composition: The dataset includes 4,248 respondents from Pew’s core American Trends Panel and an additional 3,798 respondents sourced from the SSRS Opinion Panel to intentionally boost representation.
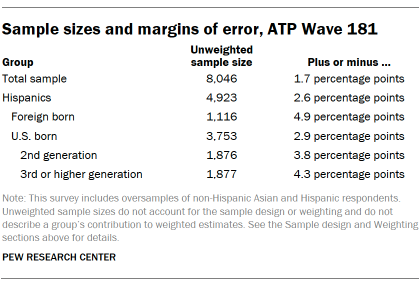
- Margin of Error: The overall margin of sampling error for the full sample of 8,046 respondents sits at plus or minus 1.7 percentage points at the 95% confidence level.
- Mode of Interviewing: SSRS conducted the survey primarily online (7,784 respondents) alongside live telephone interviews (262 respondents), offered fully in both English and Spanish.
- Technological Innovation: For the first time in this study’s context, large language models (GPT-5.2) combined with human coding were leveraged to categorize open-ended responses regarding the "American dream," achieving a micro-averaged F1 validation score of 0.89.
Chronology of Data Collection: Step-by-Step Field Execution
The execution of a nationally representative survey requires meticulous scheduling, careful pacing, and tiered deployment to manage respondent fatigue and data quality. The field period for Wave 181 followed a tightly controlled timeline across October 2025.
Early October: Preparation and Pre-Notification
Before a single survey question was answered, foundational outreach was deployed to alert selected participants and prime them for engagement.
- October 3: Prenotification postcards were mailed specifically to ATP panelists who were slated to participate via live telephone interviews, establishing initial contact.
- October 6: Postcard notifications were mailed to a subset of online panelists to build awareness ahead of digital invitations.
The Soft Launch Phase
To test system logic, survey flow, and technical stability, a "soft launch" was deployed on the first official day of fielding.
- October 6: The soft launch commenced with 801 online panelists (60 from the core ATP and 741 from the SSRS Opinion Panel). Simultaneously, phone interviewers began dialing to secure an initial benchmark of seven completed interviews (four ATP, three OP). Researchers analyzed this early data in statistical software (SPSS) to ensure all questionnaire logic, skips, and randomizations operated flawlessly.
Full Deployment and Reminders
Following successful verification of the soft launch data, the survey entered its primary collection phase.
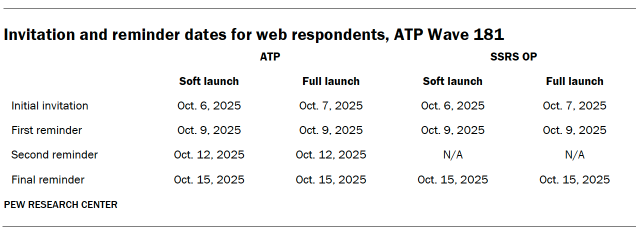
- October 7: The full launch deployed invitations to all remaining English- and Spanish-speaking sampled online panelists via email. For ATP panelists who had opted into SMS communications, text messages containing secure survey links were dispatched.
- Throughout the Field Period: Online participants who failed to complete the survey received up to three automated email and SMS reminders. Phone respondents were systematically dialed by trained bilingual interviewers, receiving up to six call attempts over the course of the field period to maximize contact rates.
- October 16: Official data collection concluded, closing the window for active field responses and transitioning the dataset into the rigorous data-cleaning, quality-control, and weighting phases.
Supporting Data: Sampling Design, Weighting, and Margins of Error
Achieving true national representation requires correcting for the inherent biases of modern communication channels. Not everyone answers phone calls, and not every household engages with digital platforms equally. Pew Research Center utilizes a sophisticated multi-stage sample design and weighting architecture to address these realities.
Panel Recruitment and Address-Based Sampling
Since 2018, the core American Trends Panel has relied on Address-Based Sampling (ABS). Using the U.S. Postal Service’s Computerized Delivery Sequence File—which covers an estimated 90% to 98% of the U.S. population—stratified random samples of households are mailed study cover letters alongside pre-incentives (ranging from $5 to $20 depending on demographic reachability). Within each household, the adult with the next birthday is selected to participate.
Oversampling and Subgroup Precision
To study smaller demographic groups with statistical confidence, Wave 181 incorporated intentional oversamples of non-Hispanic Asian and Hispanic adults. Because these groups represent smaller shares of the overall population, standard random samples yield margins of error too wide for granular analysis. By oversampling these populations—and supplementing the ATP with the SSRS Opinion Panel—researchers gathered sufficient data to analyze these crucial demographics accurately. These oversampled cohorts are subsequently weighted back to reflect their exact proportions within the broader U.S. population.
Weighting and Calibration Parameters
The weighting process accounts for multiple stages of selection and nonresponse:
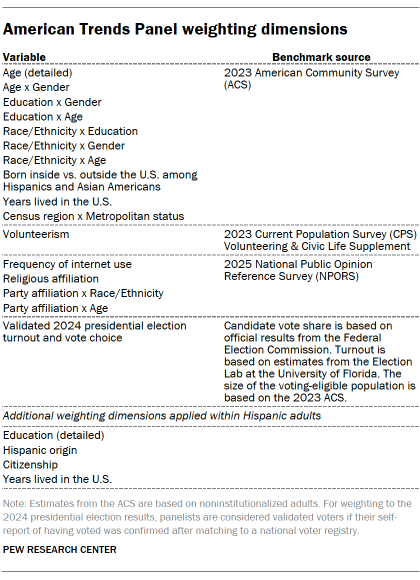
- Base Weights: Every panelist begins with a base weight reflecting their initial probability of recruitment into the panel. SSRS provided base weights for the Opinion Panel respondents, which were then integrated and scaled alongside core ATP weights.
- Calibration: Combined weights were calibrated against authoritative national population benchmarks, accounting for dimensions such as age, gender, education, race, ethnicity, nativity, and partisan affiliation.
- Trimming: Weights were trimmed at the 1st and 99.5th percentiles to mitigate precision loss caused by extreme variance in weighting values.
Sample Sizes and Error Margins Across Subgroups
| Demographic Subgroup | Unweighted Sample Size | Plus or Minus Percentage Points at 95% Confidence Level |
|---|---|---|
| Total Sample (All U.S. Adults) | 8,046 | 1.7 |
| Hispanic Adults | 3,150 | 2.5 |
| Non-Hispanic White Adults | 3,422 | 2.6 |
| Non-Hispanic Black Adults | 812 | 5.3 |
| Non-Hispanic Asian Adults | 502 | 6.7 |
(Note: Sampling error is only one potential source of error in public opinion polling; question wording, interviewer effects, and practical field difficulties can also introduce bias.)
Official Protocols: Quality Assurance and Advanced AI Coding
Maintaining data integrity across thousands of online and phone respondents requires both human vigilance and technological innovation.
Screening for Satisficing
Prior to analysis, Pew researchers screened the dataset for behavioral patterns indicative of "satisficing"—a shortcut-taking behavior where respondents race through surveys without reading questions carefully. Indicators included excessively high rates of skipped questions or instances where a respondent consistently selected only the first or last available answer choice. As a direct result of these quality checks, two ATP respondents were permanently removed from the dataset before weighting began.
The Intersection of AI and Qualitative Coding
Wave 181 broke new ground in qualitative data processing by deploying artificial intelligence to code open-ended responses. When asked the open-ended question, "In a few words, what does the American dream mean to you?" respondents provided thousands of unique, highly varied definitions. Organizing these responses manually is historically labor-intensive and prone to human fatigue.
To solve this, Pew researchers implemented a hybrid methodology integrating human interpretation with unsupervised machine learning:
- Model-Assisted Codebook Development: Researchers analyzed an initial pilot sample to identify core thematic categories, running parallel unsupervised theme-discovery models based on sparse autoencoders and large language model interpretations (utilizing the HypotheSAES method).
- Deployment via GPT-5.2: A finalized 15-category codebook was provided to OpenAI’s GPT-5.2 model, accompanied by a precise prompt instructing it to evaluate responses for substantive meaning and assign all applicable thematic codes.
- Rigorous Human Validation: To ensure the AI maintained human-level nuance, a stratified sample of 201 responses (ensuring rare categories were well-represented) was coded independently by human researchers and the AI. Comparing the two sets of results yielded a micro-averaged F1 validation score of 0.89, demonstrating exceptionally high alignment between machine classification and human judgment.
Socioeconomic Adjustments: Factoring Cost-of-Living Realities
Economic standing cannot be accurately measured by raw income alone. A family earning $50,000 a year in a rural community experiences a vastly different standard of living than a family earning that same amount in a major metropolitan center.
For Wave 181, family income data was rigorously adjusted to account for both household size and geographic cost-of-living differences. Using regional price parities, researchers evaluated local cost-of-living deviations against the national average.
- Low-Cost Regions: For example, the Pine Bluff metropolitan area in Arkansas features price levels roughly 19.7% lower than the national average.
- High-Cost Regions: Conversely, the San Francisco-Oakland-Berkeley metropolitan area in California registers price levels 18.2% higher than the national average.
Through this econometric adjustment, researchers determined that a family income of $40,200 in Pine Bluff equates in purchasing power and financial well-being to a family income of $59,100 in San Francisco. Panelists across both the core ATP and the SSRS Opinion Panel were assigned to standardized income tiers (lower, middle, or upper income) based on these adjusted median family incomes, ensuring that economic analyses reflect true material realities rather than nominal figures.
Implications: Why Methodological Transparency Matters
The meticulous architecture behind Wave 181 of the American Trends Panel is far more than an academic exercise in statistical theory; it is the vital foundation upon which credible national storytelling is built.
When researchers report on how diverse populations—particularly Hispanic and Asian communities—perceive economic mobility, civic opportunity, and cultural identity in America, the legitimacy of those insights relies entirely on the underlying methodology. By transparently detailing address-based sampling protocols, aggressive weighting calibrations, rigorous quality control, and innovative AI-assisted qualitative coding, Pew Research Center establishes a gold standard for modern survey research.
Ultimately, these protocols protect against systemic bias, honor the complexity of multicultural perspectives, and provide policymakers, journalists, and the public with an accurate, dependable mirror of the American electorate.