Main Facts
As the dust settles on the 2026 U.S. midterm elections, pollsters and political analysts are confronting a familiar post-election ritual: dissecting the accuracy of preelection surveys. With vote-counting largely finalized across the nation, data compiled by the Pew Research Center reveals two overarching conclusions about how preelection polls performed.
First, public opinion surveys successfully captured the fundamental direction of the political winds. Polls accurately diagnosed a remarkably sour national mood, widespread public dissatisfaction with President Donald Trump’s administration, and deep-seated economic anxieties centered on the cost of living—frustrations that bled even into portions of the coalition that had backed Trump in the 2024 presidential election. Furthermore, surveys correctly identified a glaring enthusiasm gap, registering that Democratic voters were significantly more engaged, eager, and likely to cast ballots than their Republican counterparts.
Second, and perhaps most critically, the polls significantly understated the magnitude of the Democratic wave. While preelection modeling correctly pointed toward potential Democratic pickups that would ultimately secure them a majority in the U.S. Senate and a takeover of the House of Representatives, the actual margins of victory far exceeded what the final polling averages projected.
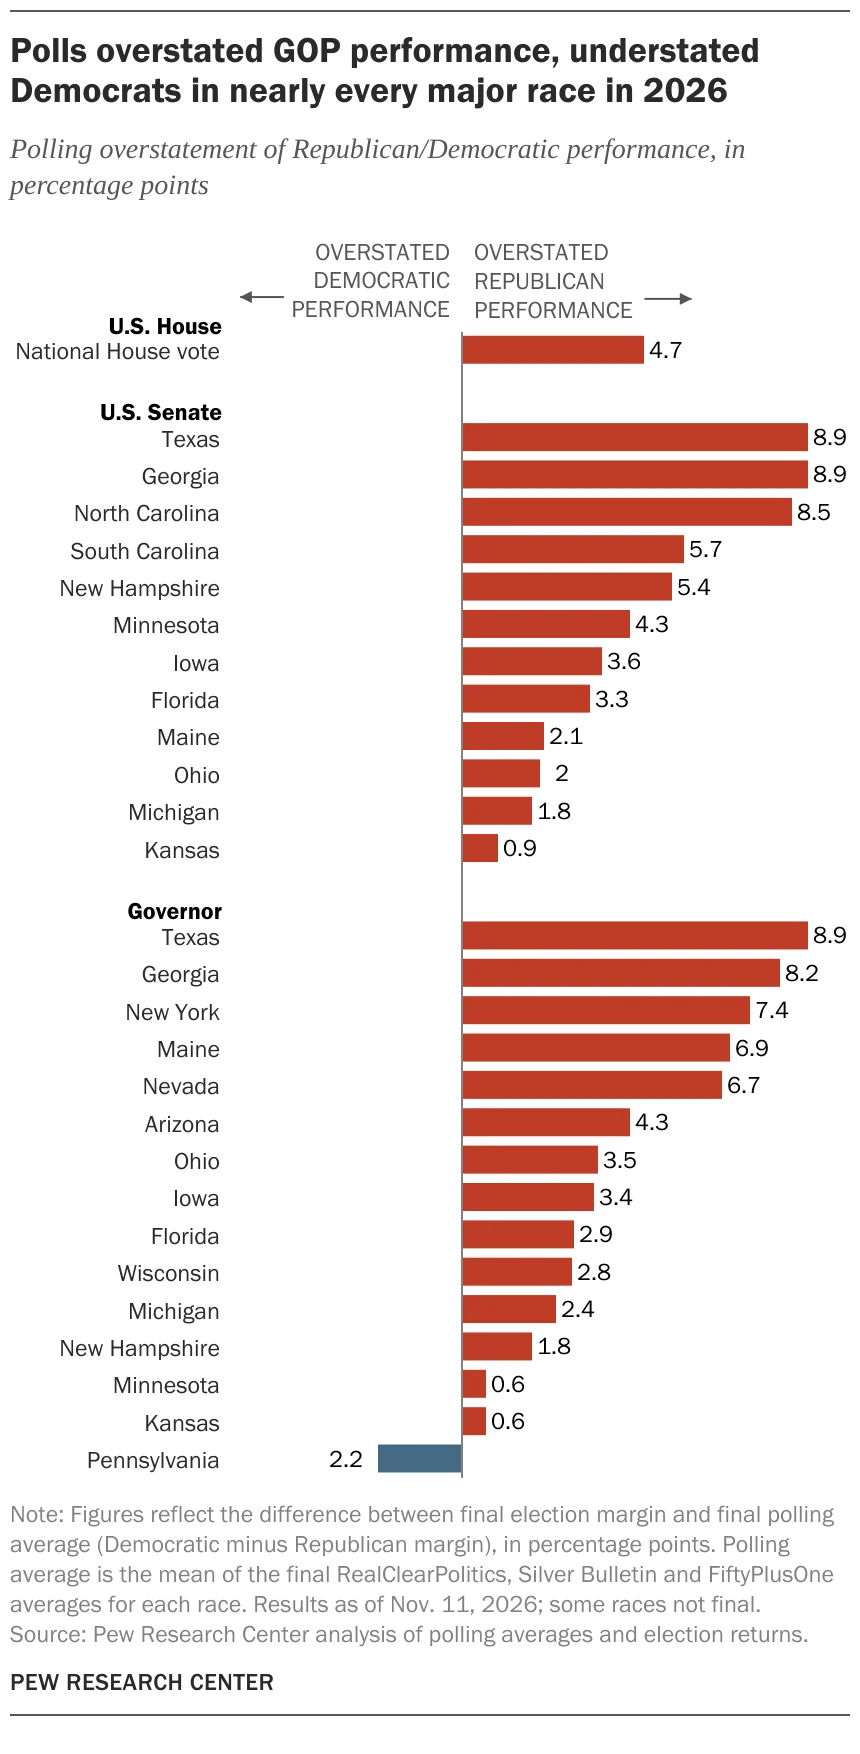
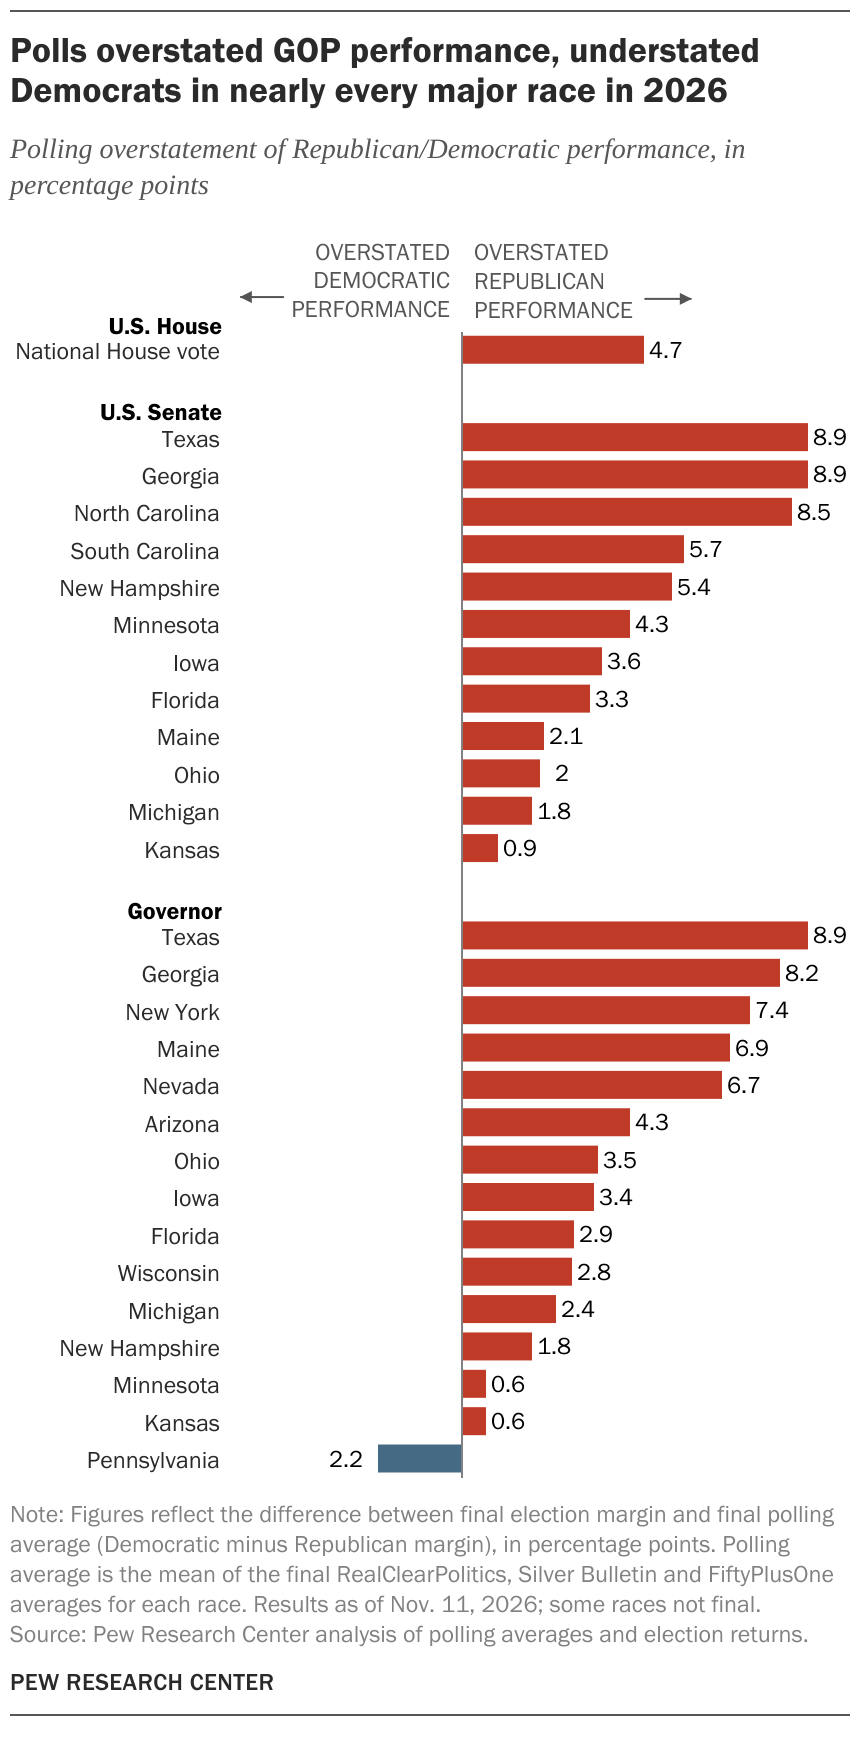
According to Pew’s comparative analysis of 27 key statewide gubernatorial and Senate races alongside national House returns, preelection polling estimates underestimated the Democratic margin by at least 2 percentage points in 21 of those 27 races. Across all 27 examined contests, the mean understatement of the Democratic margin stood at roughly 4 percentage points. While polls successfully called the winners in most scenarios, they systematically missed the true depth of the electorate’s swing toward the Democratic Party.
Chronology
The narrative of the 2026 midterm polling cycle unfolded across distinct phases, beginning with early warning signs in the fall and culminating in the final post-election audits in November.
- Early October 2026: Preelection tracking and deep-dive public opinion polls began highlighting a profound discontent among American voters. Surveys published in early October documented a stark partisan divide in enthusiasm, noting that Democratic voters were far more willing to engage with pollsters and discuss their voting intentions than Republicans, who showed signs of fatigue and lower survey response rates.
- Late October 2026: As the final weeks of the campaign wound down, media outlets and polling firms noted persistent methodological hurdles. Field researchers reported unusual friction in reaching conservative and rural voters, with Kansas and other key battlegrounds revealing that Democrats were eager to talk while Republicans were largely inaccessible or hesitant. Concurrently, national generic congressional ballot averages settled with Democrats holding a roughly 9-point advantage.
- November 6, 2026: Election Day. Millions of voters went to the polls against a backdrop of economic pessimism and voter dissatisfaction with incumbent leadership. Initial returns began rolling in late into the night, immediately hinting that traditional polling averages may have masked a broader underlying surge for Democratic candidates in key legislative and executive races.
- November 11–12, 2026: With unofficial vote counts largely stabilized across the states, the Pew Research Center published its foundational diagnostic of polling performance. The initial release revealed that polling errors—particularly the systematic understatement of Democratic margins by an average of 4 to 5 points—were slightly larger than those recorded in the 2018 and 2022 midterms, echoing the state-level presidential polling errors seen in 2020.
Supporting Data
A granular look at the data underscores just how widespread the polling understatements were across various regions and offices. Pew’s evaluation mapped final preelection polling averages—compiled from RealClearPolitics, Silver Bulletin, and FiftyPlusOne—against unofficial state election results.
Key Statewide Race Errors
The data illustrates that polling errors were heavily skewed in one direction: understating the Democratic margin.
- Texas (U.S. Senate & Governor): Both races tied for the largest individual misses in the dataset, with polls understating the Democratic margin by a striking 8.9 percentage points.
- Georgia (U.S. Senate & Governor): Georgia followed closely behind, with the Senate race showing an 8.9-point understatement and the gubernatorial race showing an 8.2-point error in favor of the Democrats.
- North Carolina (U.S. Senate): Recorded an 8.5-point understatement of the Democratic margin.
- New York (Governor): Exhibited a 7.4-point polling error understating the Democratic performance.
- Maine (Governor & Senate): Saw errors of 6.9 points and 2.1 points, respectively, understating Democratic leads.
- Nevada (Governor): Understated the Democratic margin by 6.7 percentage points.
Out of the 27 races analyzed, only one major contest featured a notable overstatement of the Democratic candidate’s margin: Pennsylvania’s gubernatorial race, where polls overstated the Democratic margin by 2.2 percentage points (though incumbent Governor Josh Shapiro still cruised to a commanding victory by roughly 22 points).
The National House Vote and Historical Context
On the generic congressional ballot, RealClearPolitics averages pegged the national Democratic advantage at nearly 9 percentage points heading into Election Day. However, the combined popular vote for the U.S. House ultimately revealed a Democratic lead of just under 14 points, yielding a national polling error of roughly 4.7 percentage points.
When placed in historical perspective, an average error of 4 to 5 points across all race types exceeds the margin of error documented for comparable midterm cycles in 2018 and 2022 by the American Association for Public Opinion Research (AAPOR). It sits slightly above the state-level polling errors seen in the 2024 presidential and Senate contests, matches the error margins observed in the 2024 gubernatorial races, and mirrors the state-level presidential polling flaws from 2020, when surveys similarly overstated the Democratic candidate’s standing.
Official Responses and Methodological Analysis
The polling industry and academic researchers have responded to the 2026 discrepancies with a mixture of rigorous self-reflection and analytical caution. Industry leaders emphasize that diagnosing the exact root causes of polling misses requires meticulous, time-consuming post-mortem data collection—particularly regarding voter file matches and actual turnout demographics.
Methodologists are currently focusing on several critical variables to understand why Democratic candidates outperformed expectations:
- The Turnout Versus Vote Choice Dynamic: Preelection polls must accurately answer two distinct questions: Who will actually show up to vote, and how will they vote once they arrive? Researchers note that changes in the composition of the electorate between 2024 and 2026 may not have been fully captured by traditional "likely voter" models. Panel surveys and validated voter data will be vital in determining whether the error stemmed from shifting voter preferences late in the cycle or unpredicted demographic shifts in turnout.
- Weighting Adjustments and Nonresponse Bias: Over the past several election cycles, pollsters have heavily scrutinized how they weight samples based on past voting behavior and party affiliation to ensure adequate representation of conservative and Republican voters. While these adjustments are designed to correct historical undercounts of conservative bases, questions remain over whether specific weighting formulas inadvertently distorted final predictions or failed to account for asymmetrical enthusiasm and response rates.
- Unique 2026 Challenges: Industry professionals pointed out ahead of the midterms that 2026 presented unique environmental and structural difficulties for survey research, ranging from communication barriers to rapidly shifting economic sentiment.
Despite these challenges, experts stress that the polls were not entirely inaccurate; they successfully illuminated the qualitative reality of the political landscape. They laid bare the public’s sour mood, accurately tracked widespread economic discontent, and correctly diagnosed the motivational fire driving the Democratic base.
Implications
The systematic under-polling of Democratic candidates in the 2026 midterms carries profound implications for the future of political science, campaign strategy, and public trust in survey research.
- Restoring Public and Media Trust: When polls miss by 4 to 8 points in major battlegrounds like Texas, Georgia, and North Carolina, it fuels public skepticism regarding the utility of polling. While pollsters successfully identified the structural shift and the eventual winners in Congress, the persistent underestimation of margins risks eroding confidence among casual observers who equate a "miss on the margin" with a "total failure of the science." Rebuilding this trust will require increased transparency in polling methodologies and clearer communication about the inherent limitations of preelection forecasting.
- Strategic Adjustments for Future Campaigns: Political strategists on both sides of the aisle rely heavily on polling averages to allocate financial resources, target media buys, and deploy ground troops. The 2026 undercount of the Democratic wave means campaigns must refine how they measure enthusiasm gaps and nonresponse bias. For Democrats, the results prove that grassroots engagement ran deeper than mainstream models captured; for Republicans, the miss suggests that conventional turnout modeling may have overly relied on past baseline assumptions without accounting for late-breaking shifts in independent and disillusioned voters.
- The Evolution of Polling Methodology: As the industry absorbs the lessons of 2026, methodological innovation will remain paramount. The reliance on traditional telephone and online panels will continue to face scrutiny as response rates fluctuate. The ongoing integration of voter file data, creative weighting models, and multi-mode surveying will be essential for pollsters striving to narrow error margins in the upcoming 2028 presidential cycle.
Ultimately, while the 2026 midterms proved that preelection polling remains a powerful instrument for mapping political direction and public sentiment, they also served as a stark reminder that translating complex human behavior into precise mathematical percentages remains one of modern democracy’s greatest challenges.