As the United States approaches the critical midterm elections, the economy has cemented its status as the paramount concern for the American electorate. Among the various economic indicators weighing on the national psyche, none is as visceral or as immediate as the price of gasoline and diesel fuel. According to a comprehensive recent study by the Pew Research Center, nearly three-quarters of Americans (74%) report being "very concerned" about current energy costs. This figure represents a dramatic escalation from the 60% recorded in July and a staggering climb from the 43% seen at the start of the year in January.
As political campaigns intensify, the fluctuating cost at the pump has become a central point of debate, serving as both a barometer for national economic health and a potent issue that divides voters along ideological and geographic lines.
The Chronology of a Crisis: From Stability to Surge
The trajectory of fuel prices throughout 2026 has been defined by geopolitical instability, most notably the U.S.-Iran military conflict. In late February, immediately preceding the initial wave of regional hostilities, the national average price for a gallon of regular unleaded gasoline stood at a relatively modest $2.80, according to data from the U.S. Energy Information Administration (EIA).
As the conflict escalated, supply chain fears and global market volatility triggered a sharp, sustained increase. By mid-May, the national average had climbed to a peak of approximately $4.35 per gallon. While the price retreated slightly over the summer months, it remained elevated. As of October 26, 2026, the national average sat at $4.12 per gallon—a 47.4% increase from the February baseline.
The situation is even more pronounced for the transportation and logistics sectors. Highway diesel fuel, the lifeblood of the American trucking and shipping industry, saw an even more aggressive surge. Prices for diesel rose from $3.81 per gallon in late February to $6.35 by October 26, marking a 66.8% increase. This spike has created significant inflationary pressure on goods and services across the economy, as higher fuel costs are inevitably passed down to the consumer.
Understanding the Long-Term Context
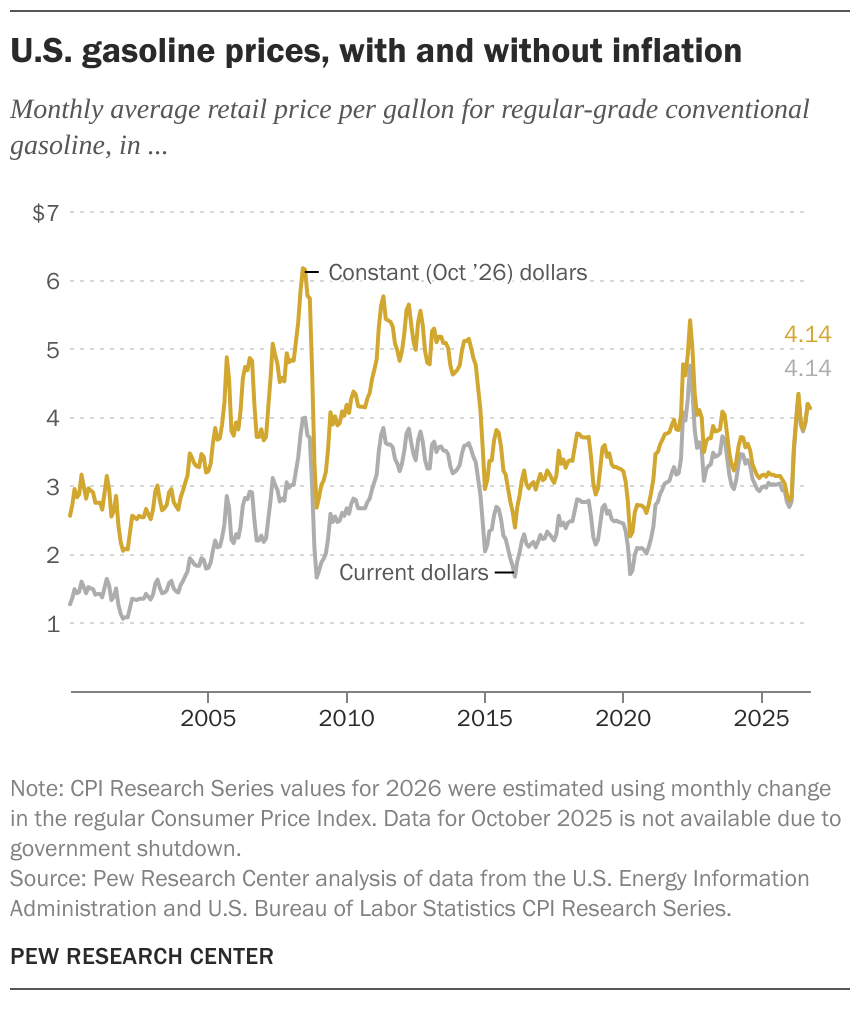
While current prices dominate daily headlines, economists and analysts often look to historical data to provide a necessary sense of scale. When adjusted for inflation, today’s prices, while painful, are not necessarily the highest in modern history.

Pew Research Center’s analysis, spanning from September 1990 to October 2026, reveals that June 2008 remains the most expensive month for fuel in the U.S. when inflation is accounted for. In that month, the national average for regular unleaded reached $6.18 in 2026 dollars, while diesel hit an eye-watering $7.26 per gallon. That peak was abruptly severed by the onset of the global financial crisis, which triggered a massive, demand-destroying recession.
However, the current situation differs from 2008 in terms of the broader economic environment, particularly regarding labor earnings. A critical metric in understanding the true cost of energy is not just the price at the pump, but the amount of labor required to afford it.
Labor and Purchasing Power: The "Minutes of Work" Metric
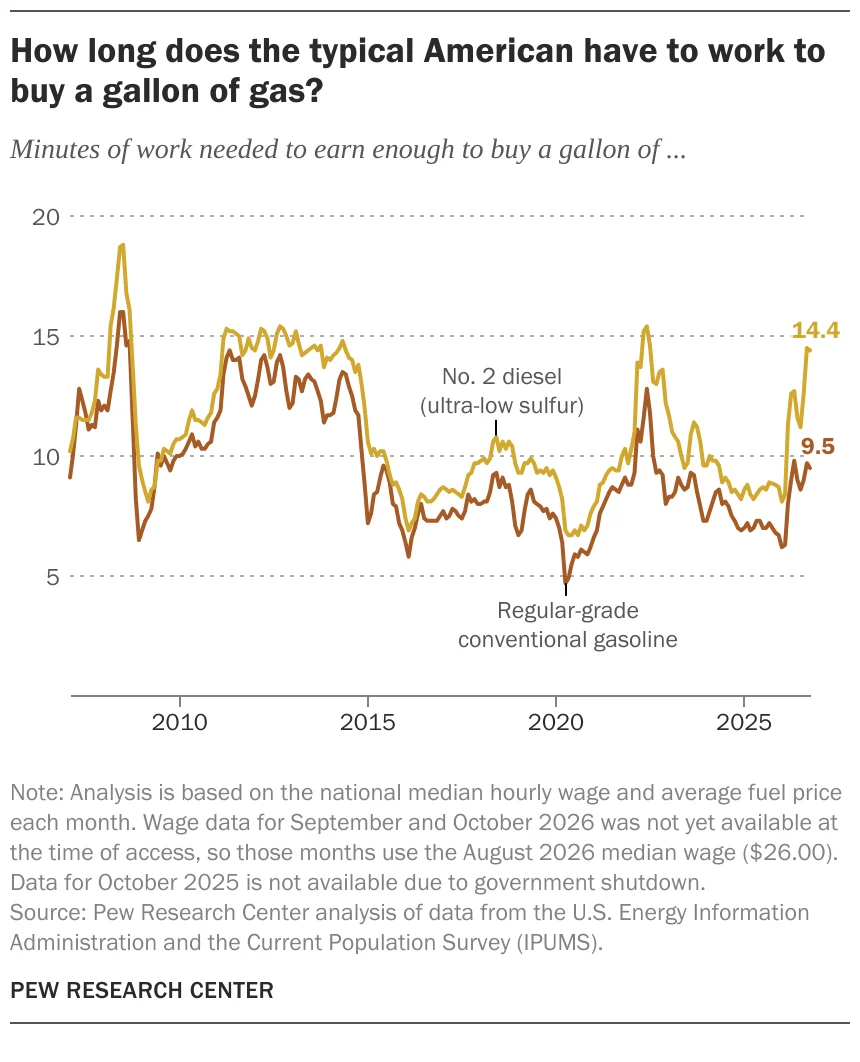
To better gauge the impact on the average household, researchers calculated the number of minutes a median-wage worker must labor to purchase a single gallon of gas.
In October 2026, a worker earning the national median wage of $26.00 per hour would have to work approximately 9.5 minutes to afford one gallon of regular gasoline. This is a marked increase from February 2026, when it required only 6.3 minutes of labor. Yet, comparing this to the historical peak in July 2008—when it took 16 minutes of work—highlights the complexities of measuring "affordability" against wage growth and energy volatility.
The low point for this metric occurred in April 2020, during the height of the COVID-19 pandemic. With the economy largely shuttered and demand for fuel plummeting, the cost of a gallon fell to just 4.7 minutes of labor. The return to a 9.5-minute requirement today underscores the significant recovery in demand coupled with the supply-side pressures currently plaguing the market.
Structural Differences: Gas Grades and Regulations
The gasoline market is not a monolith, and consumers are increasingly feeling the pinch of shifting price spreads between different types of fuel.
Historically, the price differential between regular, midgrade, and premium gasoline was relatively stable. Since 1994, midgrade typically cost 10 cents more than regular, with premium costing 20 cents more. However, those spreads have expanded significantly. By October 2026, the gap had widened to nearly 49 cents for midgrade and over 91 cents for premium, placing a disproportionate burden on drivers of higher-performance or older vehicles that require higher octane fuel.
Furthermore, the price of "reformulated" gasoline—a cleaner-burning fuel required by law in California, the Northeastern seaboard, and several other major urban areas—has surged compared to conventional gasoline. In 1996, the price gap was a mere 3 cents per gallon. By 2016, that gap had grown to 18.8 cents. As of October 2026, the spread reached 62.6 cents, illustrating how environmental mandates can interact with market volatility to create regional cost disparities.
Regional Disparities: Geography as a Cost Factor
Where a consumer lives plays a massive role in their fuel costs. The United States petroleum infrastructure is heavily concentrated along the Gulf Coast, which generally enjoys the lowest prices in the nation. As of late October 2026, Gulf Coast residents paid an average of $3.70 per gallon.
In contrast, the West Coast remains the most expensive region for fuel. In California, the average price reached $5.89 per gallon in late October. The California Energy Commission attributes this to a combination of factors, including:
- Specific Fuel Blends: California’s stringent air quality standards require unique, more expensive gasoline formulations.
- Import Dependency: Unlike other regions that can easily source fuel from neighboring states, California’s isolated market often requires importing fuel from international sources when local refineries face disruptions.
- High State Taxes and Fees: California maintains some of the highest fuel-related taxes and environmental regulatory fees in the country, which are baked into the final pump price.
Official Perspectives and Implications for the Midterms
The Biden administration and members of Congress have faced immense pressure to mitigate these costs. While the federal government has limited direct control over global oil markets, policy discussions have centered on the release of Strategic Petroleum Reserves, incentives for domestic oil and gas production, and the potential for a temporary federal gas tax holiday.
Opponents, however, argue that these measures are stopgap solutions that fail to address the long-term need for energy independence. They emphasize that the transition to renewable energy sources—while necessary for climate goals—must be balanced with the current reality of fossil fuel dependency to avoid further economic instability.

For the midterm elections, these divergent views are being weaponized by both parties. Incumbents are pointing to global supply chain issues and the international conflict as the primary drivers of inflation, while challengers are framing the price at the pump as a failure of domestic energy policy.
Broader Economic Implications
The surge in fuel prices has implications far beyond the gas station. Because fuel is a primary input for shipping, agriculture, and manufacturing, the cost of almost every consumer good has been affected. Persistent, high energy costs contribute to a feedback loop of inflation, where wage earners demand higher pay to keep up with the cost of living, which in turn leads businesses to raise prices further.
Moreover, the psychological impact on the voter cannot be overstated. When fuel prices spike, they serve as a daily, unavoidable reminder of economic volatility. For many families, the cost of commuting to work or transporting children has become a significant portion of their monthly budget, leaving less room for discretionary spending.
As the midterm results draw near, the electorate’s frustration with energy prices will likely prove to be a deciding factor. While historical data suggests that voters are sensitive to pump prices, the 2026 landscape is unique in its combination of post-pandemic recovery, international military conflict, and record-breaking inflationary pressures.
In conclusion, the current state of U.S. fuel prices is a multifaceted issue that defies simple solutions. It is a product of global market mechanics, regional regulatory frameworks, and a complex labor market. As the country looks toward the future, the challenge for policymakers will be to reconcile the need for energy stability with the urgent requirements of a modern, environmentally conscious economy—all while navigating the immediate, and often volatile, demands of the American public.