The global energy landscape is undergoing its most significant transformation since the Industrial Revolution. As the world’s appetite for electricity reaches unprecedented levels, the fundamental question of where that energy originates has become the defining challenge of the 21st century. New analysis from the Pew Research Center, utilizing data from the independent energy think tank Ember, reveals a world in the midst of a precarious yet profound shift: while fossil fuels remain the dominant bedrock of global power, the rapid ascent of wind and solar energy is fundamentally altering the grid.
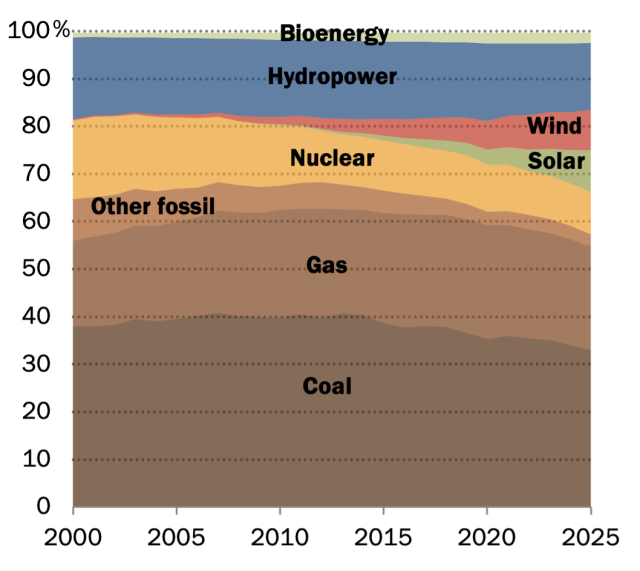
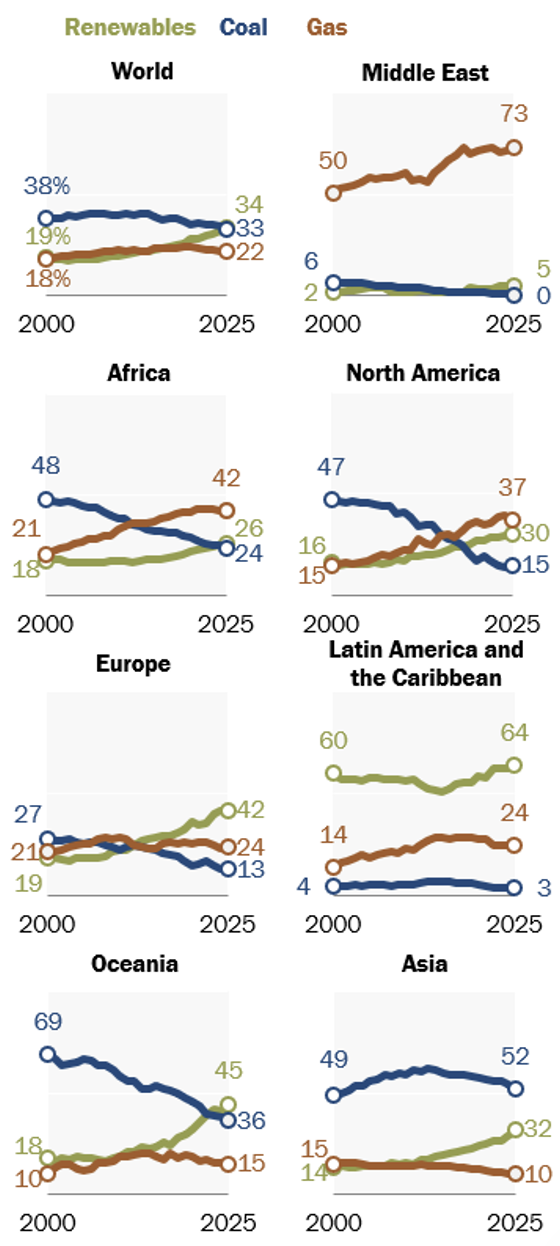
In 2025, a critical threshold was reached. For the first time in modern history, renewable energy sources—including wind, solar, hydropower, and bioenergy—collectively accounted for a larger share of global electricity production than coal (34% versus 33%). This shift marks a significant departure from the turn of the millennium, signaling that the long-term trend toward decarbonization is finally beginning to manifest in tangible, global output metrics.
Main Facts: The Evolving Composition of the Grid
The data presents a clear picture of an energy system in flux. In 2000, fossil fuels were responsible for 65% of global electricity generation. By 2025, that figure had fallen to 57%. While the decline may seem incremental, the absolute volume of electricity being generated has more than doubled in that same period, meaning the relative drop in fossil fuel dependency represents a massive displacement of coal and gas by cleaner alternatives.
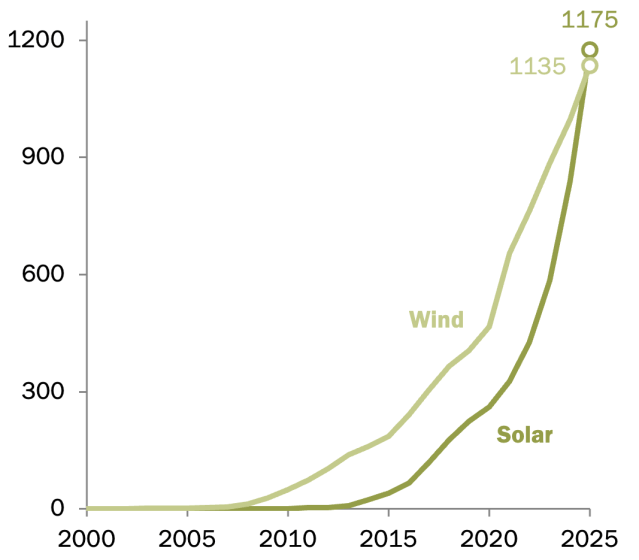
The most aggressive growth has occurred in the solar and wind sectors. In 2015, these two sources combined accounted for less than 5% of global electricity. By 2025, that figure had ballooned to 17%. Solar power, in particular, has seen a meteoric rise, growing from a negligible 0.01% at the turn of the century to 9% of global electricity production in 2025.
Conversely, nuclear energy has seen a steady decline, falling from 17% of global generation in 2000 to just 9% in 2025. This contraction is not uniform; it is the result of varying national policies, aging infrastructure, and, in some cases, a public retreat from nuclear power following major accidents, such as the 2011 Fukushima disaster in Japan.
A Chronology of Change: From Coal to Photovoltaics
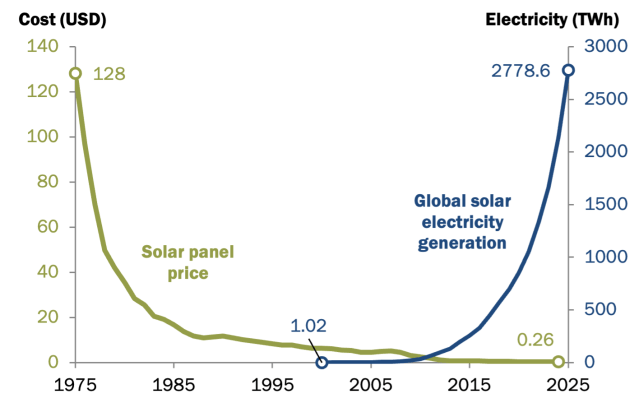
To understand how we reached this point, one must look at the economic forces at play. The primary driver of the solar revolution is the plummeting cost of technology. In 1975, the average price of a solar panel was approximately $128 per watt (in constant 2024 dollars). By 2024, that cost had crashed to $0.26 per watt—a reduction of more than 99%.
The Early 2000s: The Coal-Heavy Baseline
At the start of the century, the global grid was heavily reliant on coal. In 2000, 38% of all electricity was derived from burning coal. Developing economies, particularly in Asia, fueled their rapid urbanization through cheap, abundant coal-fired power. During this period, renewables were largely limited to established, large-scale projects like traditional hydropower, which provided about 17% of the global mix.
2010–2020: The Scaling Phase
The second decade of the century saw the first real cracks in the fossil fuel monopoly. As the price of silicon-based photovoltaics fell, nations began to diversify. China, in particular, began a massive pivot toward renewables. By 2015, global wind and solar usage climbed past the 3% mark.
2020–2025: The Acceleration
The last five years have seen an exponential increase in deployment. In 2020, solar power accounted for 3% of the global electricity mix; by 2025, that had tripled to 9%. This acceleration is not just a result of environmental policy, but of pure economic utility. In many regions, building new solar or wind capacity is now cheaper than maintaining existing coal plants.
Supporting Data: Regional Disparities
The global average, while informative, masks significant regional variations. The energy transition is not occurring at the same speed everywhere.
The European Union’s Leadership
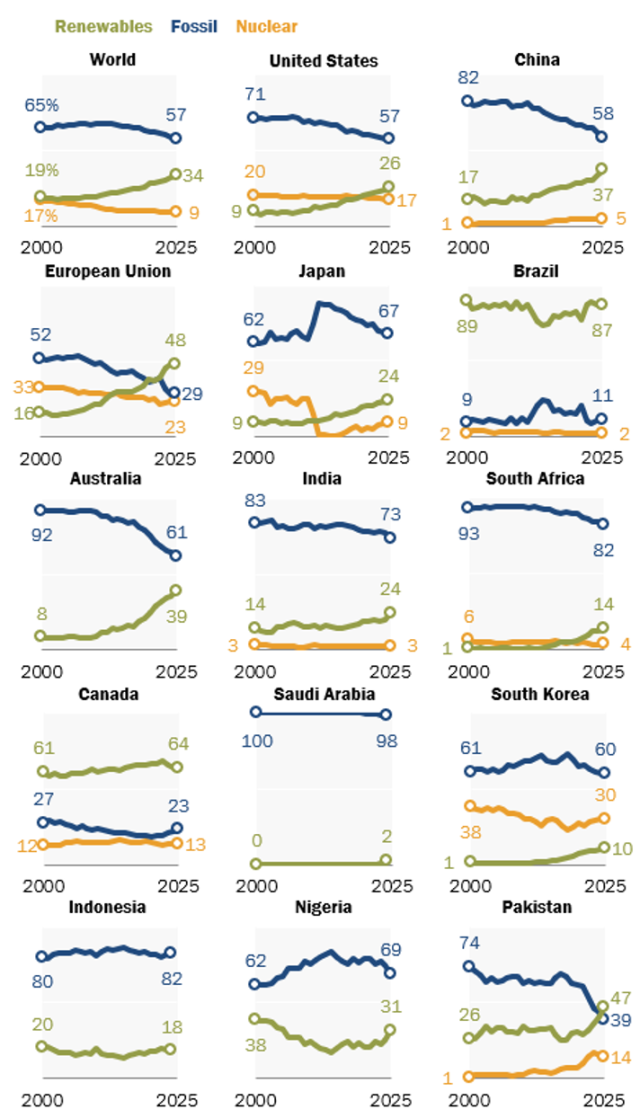
The EU has emerged as a vanguard in this transition. In 2025, nearly half (48%) of all electricity in the European Union was generated from renewable sources. This is a testament to the bloc’s aggressive legislative push toward a "Green Deal" and a systematic reduction in fossil fuel subsidies.
The Asian Powerhouse
Asia represents the most complex energy story. While the region generated 298% more electricity in 2025 than in 2000, this growth has been uneven. China is now the world’s undisputed leader in clean-energy manufacturing and deployment. In 2025, China added more electricity from solar than the entire United Kingdom produced from all sources combined. However, the region also faces the challenge of rising coal demand in Southeast Asia, where ASEAN member states have more than doubled their collective reliance on coal since 2000.
North America and Africa: The Gas Pivot
In both North America and Africa, natural gas has effectively replaced coal as the primary fossil fuel. In North America, coal’s share of electricity generation dropped from 47% in 2000 to 15% in 2025, with gas picking up the slack. Similarly, African nations have leaned heavily into natural gas, with generation rising from 92 terawatt-hours in 2000 to 419 terawatt-hours in 2025, often utilizing it as a bridge fuel to support economic development.
Official Responses and Strategic Planning
Governments across the globe are currently recalibrating their "Vision 2030" and "2050" plans to reflect these realities. Saudi Arabia, for instance, a nation historically synonymous with oil, is actively pursuing a civil nuclear program and expanding its renewable footprint as part of its Vision 2030 plan. The objective is to decouple its domestic economy from its primary export, ensuring long-term fiscal stability.
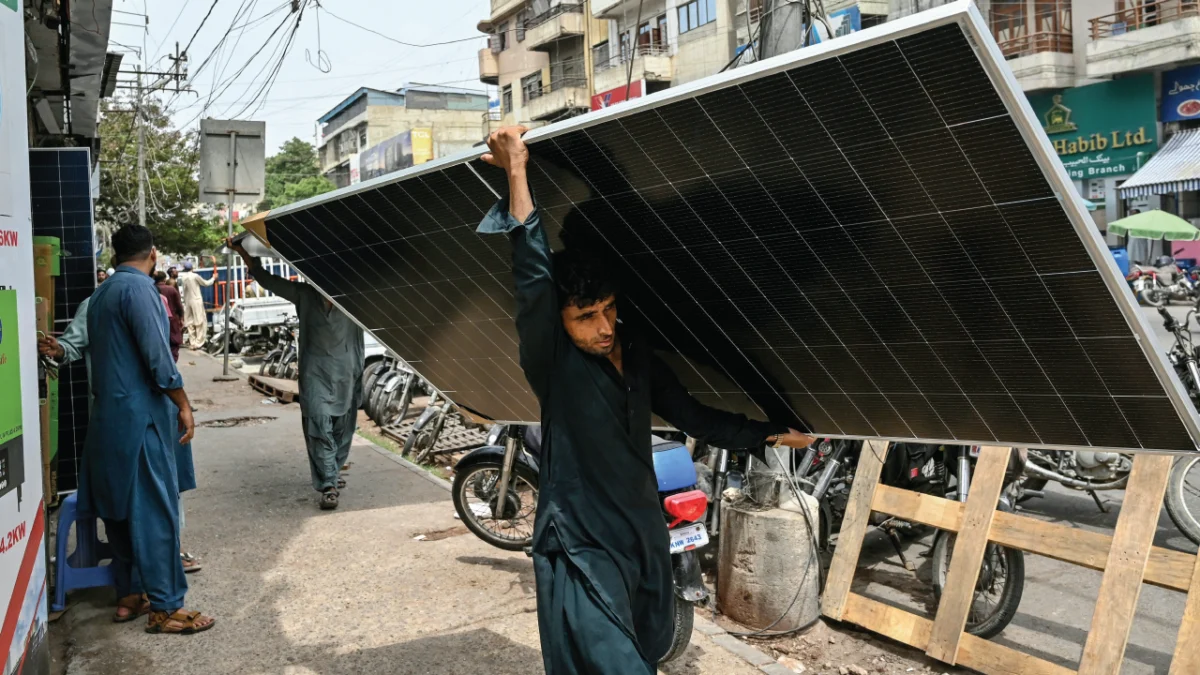
In Pakistan, a grassroots solar boom has surprised even energy analysts. Driven by high electricity costs and supply instability, households and businesses have shifted toward decentralized solar installations, causing renewable sources to overtake fossil fuels in the national energy mix as of 2025. This "people-led" energy transition highlights how economic necessity can sometimes outpace government policy.
The Implications: A Grid Under Pressure
The data reveals a critical nuance: increased electricity demand. The world is using far more energy today than it did in 2000. This means that even if a source like hydropower declines as a percentage of the total mix, it may still be producing more absolute terawatt-hours than it did two decades ago.
The primary implication of these trends is the challenge of grid stability. As intermittent sources like wind and solar grow to represent 17% of the total mix, the need for battery storage and smart-grid infrastructure becomes paramount. China’s dominance in the battery and electric vehicle (EV) supply chain is not merely an industrial success story; it is a strategic advantage in managing this volatile energy mix.
Furthermore, the widening gap between the energy-hungry growth of Asia and the relatively stagnant demand growth in Europe and North America suggests that the future of the climate crisis will be decided in the East. With China accounting for 56% of global demand growth between 2000 and 2025, its continued investment in renewables is the single most important variable in the global climate equation.
Conclusion
The global energy transition is no longer a theoretical exercise—it is a statistical reality reflected in the 2025 data. We have entered an era where the cost-effectiveness of renewables is driving the market, and the dominance of fossil fuels is being steadily eroded. However, the path forward is complex. It requires not just the installation of more solar panels, but a total re-engineering of how power is stored, transmitted, and consumed. As the world reaches for 2030, the data confirms that while the fossil fuel era is waning, the era of clean energy is only just beginning to find its stride.