WASHINGTON — As the United States navigates its current political landscape, a quiet yet profound demographic shift is reshaping the American electorate. According to a comprehensive Pew Research Center analysis of U.S. Census Bureau data, approximately 250 million people are eligible to cast ballots in the midterm elections. Among them, roughly one in ten—amounting to 25 million individuals—are naturalized U.S. citizens.
This growing bloc of immigrant voters represents more than just a statistical milestone; it is a dynamic, diverse, and increasingly influential constituency that defies simple political categorization. Spanning all 50 states and the District of Columbia, naturalized citizens are leaving an indelible mark on local, state, and federal elections, altering the calculus for political campaigns nationwide.
Main Facts: The Scope and Scale of the Naturalized Electorate
To understand the modern American voter, one must look closely at the sheer velocity at which the naturalized voting population has expanded. Naturalized citizens are individuals born outside the United States who have successfully navigated the rigorous legal pathway to acquire American citizenship. Like their U.S.-born peers, they attain full voting rights upon turning 18 years old.
The sheer growth of this population is staggering. Between 2000 and 2024, the number of naturalized citizens eligible to vote more than doubled. This rate of expansion far outpaces the growth rate of the total eligible voter population during the same quarter-century.

- The 2000 Baseline: At the turn of the millennium, roughly 12 million naturalized citizens were eligible to vote, accounting for just 6.2% of the total U.S. electorate.
- The 2024 Milestone: By 2024, that figure surged to over 25.1 million, pushing the naturalized share of the electorate to an all-time high of 10.3%.
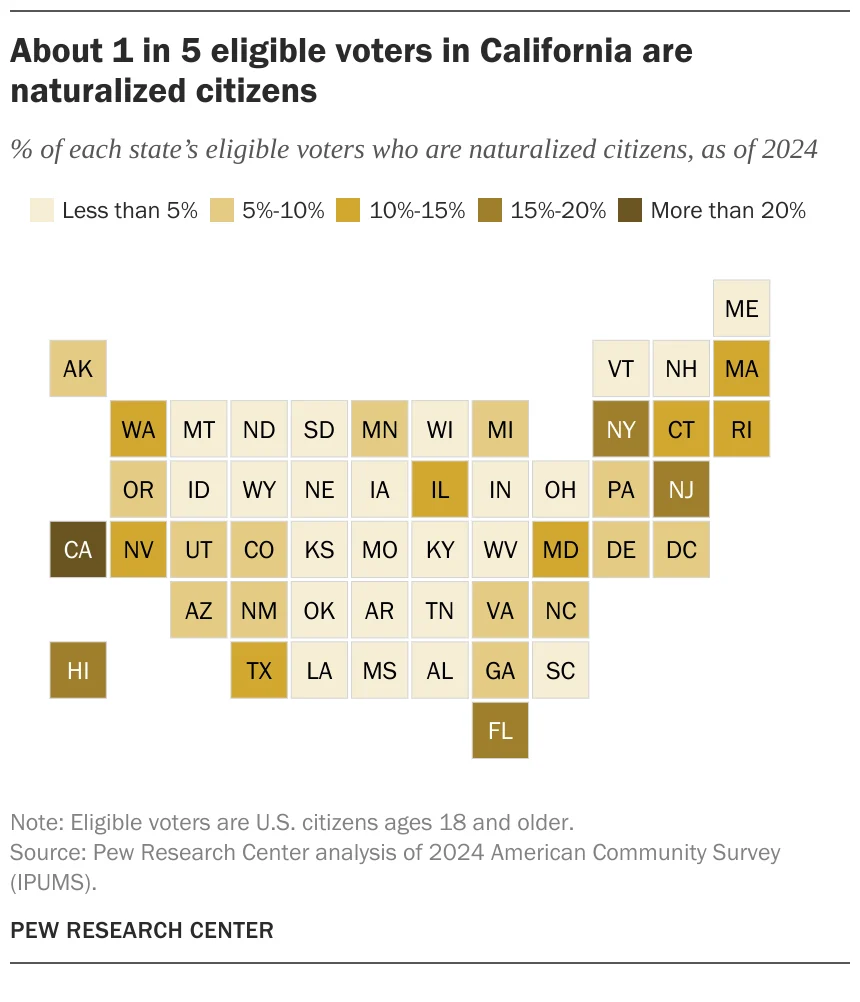
- Geographic Concentration: While naturalized voters live in every corner of the country, they are heavily concentrated in several key states. In California, nearly 22% of all eligible voters were born abroad. Other states with exceptionally high shares include New Jersey (19.8%), New York (18.9%), Florida (17.2%), Hawaii (15.6%), and Nevada (14.6%). Conversely, states like Montana (1.4%), Mississippi (1.3%), and West Virginia (1.2%) report the smallest shares.
Chronology: Two Decades of Steady Growth
The expansion of the naturalized electorate is not a sudden anomaly, but rather the result of decades of steady immigration patterns combined with successful naturalization pipelines. A historical review of U.S. Census Bureau and American Community Survey (IPUMS) data illustrates this upward trajectory:
- 2000: Naturalized citizens made up 6.2% (11.98 million) of a total eligible voting population of roughly 193.3 million.
- 2006: Following a post-2000 wave of green card holders seeking security and civic integration, the share climbed to 7.3%.
- 2008: Amid a historic presidential election cycle, the number reached 15.7 million, representing 7.5% of eligible voters.
- 2012: The share surpassed the 8% threshold, totaling nearly 18 million eligible voters (8.2%).
- 2016: Reflecting heightened political engagement and increased naturalization outreach, the share ticked up to 9.0%, or 20.6 million voters.
- 2018: During the midterm elections, naturalized citizens accounted for 9.4% (22 million) of the electorate.
- 2022: Continuing its post-pandemic rise, the figure crossed the 9.9% mark (23.8 million).
- 2024: The share officially crossed into double digits at 10.3%, representing 25.1 million naturalized citizens within a total eligible voter pool of 245.3 million.
Supporting Data: Demographics, Diversity, and Origins
A deeper examination of the data reveals that naturalized eligible voters are far from a monolithic bloc. They vary widely in their geographic origins, racial makeup, linguistic backgrounds, socioeconomic status, and age distribution.
Countries of Origin
Mexico remains the single largest country of origin for naturalized eligible voters, accounting for approximately 15% of the total group. However, other nations represent significant shares of the pie:
- Philippines: 6.4%
- India: 5.8%
- China: 4.8%
- Vietnam: 4.4%
Notably, while these five countries have topped the list for years, shifting dynamics have occurred. Most recently, the Philippines surpassed both India and China to become the second most common country of origin, driven by historically high naturalization rates among Filipino immigrants.

Racial and Ethnic Composition
The racial and ethnic diversity of naturalized voters mirrors the global scope of U.S. immigration:
- Hispanic adults make up the largest share at 33.2%.
- Asian adults follow closely at 32.3%.
- White adults account for 20.1%.
- Black adults represent 10.7%.
When looking specifically within racial and ethnic groups, the contrast is stark. Asians are the only major demographic group where the majority of eligible voters are immigrants—nearly two-thirds (64.7%) of all Asian eligible voters are naturalized citizens. By comparison, naturalized citizens account for 23.7% of Hispanic eligible voters, 9.2% of Black eligible voters, and 3.3% of White eligible voters.
Linguistic Profiles
While federal law requires naturalization applicants to demonstrate proficiency in English—barring specific age and residency exemptions—linguistic diversity remains a hallmark of this population.
- An overwhelming 96.4% of naturalized eligible voters speak English, a figure nearly on par with U.S.-born citizens (99.9%).
- However, naturalized citizens are far more likely to be bilingual or multilingual. Approximately 76.0% speak English and at least one other language at home, compared to just 10.2% of U.S.-born voters.
- Among naturalized voters, Spanish is the most common non-English language spoken, followed by Chinese, Hindi and related languages, and Filipino/Tagalog.
Age, Income, and Education
Demographically, naturalized eligible voters tend to be older, more financially established, and highly educated compared to their U.S.-born counterparts:

- Age: The median age for a naturalized eligible voter is 54, compared to 47 for U.S.-born voters. Nearly 60% (59.8%) are aged 50 and older, while only 7.5% are between the ages of 18 and 29.
- Income: The median family income for naturalized eligible voters stands at $105,000, outpacing the $94,000 median family income recorded for U.S.-born eligible voters. Over half (52.8%) live in households earning $100,000 or more per year.
- Education: Naturalized citizens exhibit strong educational attainment. Nearly four in ten (39.8%) hold a bachelor’s degree or higher, compared with 34.1% of U.S.-born eligible voters.
Official Responses and Civic Implications
Political analysts, civil rights organizations, and electoral experts have increasingly focused on the unique behavioral patterns and civic priorities of naturalized citizens. Because these voters have actively chosen to undergo a complex legal process to gain citizenship, their participation rates in civic life often reflect a deep appreciation for the democratic process.
"Naturalized citizens represent a vital cornerstone of the modern American electorate," notes demographic research from public policy institutes. "Their long-term residency patterns—with over 92% having lived in the U.S. for 11 years or more, and 73% residing in the country for over two decades—mean they are deeply integrated into their local economies, communities, and tax bases."
Political campaigns have taken notice. In battleground states like Nevada, Florida, and Arizona, where naturalized citizens comprise significant percentages of the electorate (14.6%, 17.2%, and 8.6% respectively), targeted outreach in multiple languages has become a standard campaign strategy. Parties can no longer treat immigrant communities as peripheral; rather, messaging on the economy, healthcare, education, and foreign policy must directly resonate with populations that span diverse cultural backgrounds.
Furthermore, the longevity of these voters in the United States dispels common misconceptions. Far from being recent arrivals unfamiliar with American civic norms, the vast majority of naturalized voters have built decades-long roots, buying homes, raising families, and establishing careers long before stepping into a voting booth.

Broader Implications for Future Elections
As the United States looks toward future election cycles, the trajectory of the naturalized electorate points toward continued expansion. With immigration continuing to feed the pipeline of lawful permanent residents eligible for naturalization, the 10.3% share recorded in 2024 is unlikely to be a ceiling.
The implications for policy makers are clear. Issues that disproportionately affect immigrant communities—such as family-based visa backlogs, citizenship application processing times, foreign credential recognition, and international trade—intersect directly with the domestic concerns of middle-class and upper-middle-class families. Because naturalized voters often bridge multiple cultural and linguistic worlds, their ballot box decisions frequently serve as a bellwether for broader economic and social shifts across the United States.
Ultimately, the story of America’s naturalized voters is one of integration, resilience, and civic dedication. As they comprise an ever-larger share of the electorate, their voices will increasingly dictate the trajectory of American democracy for generations to come.