

In an era defined by rapid digital transformation and shifting social dynamics, understanding how Americans engage with their communities, government, and the news cycle has never been more critical. To gain this insight, the Pew Research Center, in partnership with SSRS, conducted an exhaustive research initiative throughout 2025. This effort culminated in the "Cross-Sectional Engagement Survey," a massive data-gathering project designed to map the landscape of American civic life. By utilizing a rigorous, multimode methodology, the study provides a nuanced look at the behaviors that define public participation in the United States today.
Main Facts: A Comprehensive Overview
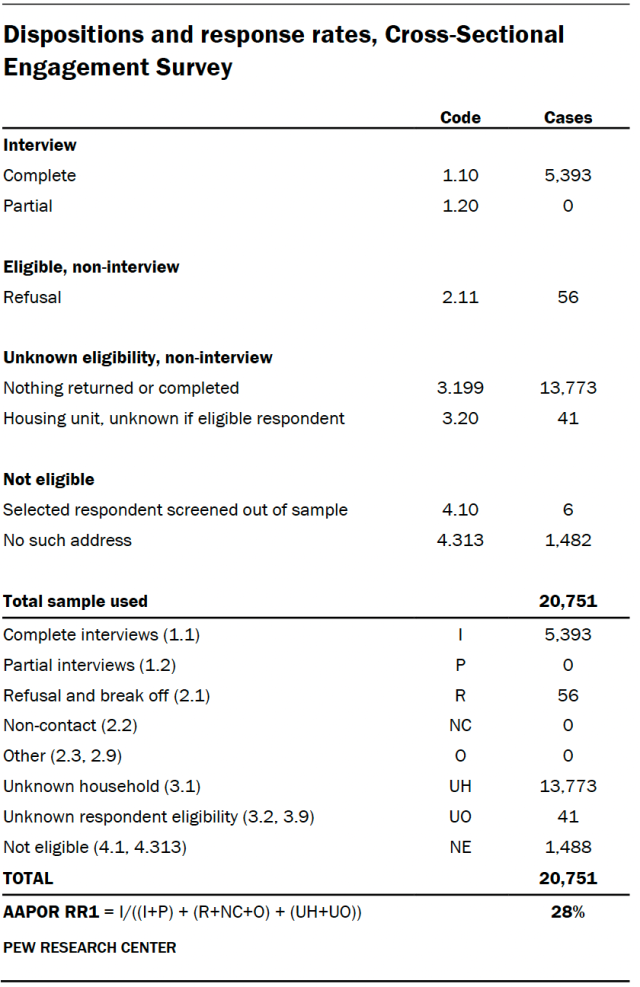
The 2025 Cross-Sectional Engagement Survey was a multi-month endeavor, fielding from July 9 to December 5, 2025. With a final sample size (n) of 5,393 respondents, the survey serves as a robust foundation for analyzing modern American engagement.

The methodology employed was address-based sampling (ABS), ensuring that the survey reached a representative slice of the noninstitutionalized U.S. adult population. Respondents had the flexibility to complete the survey via three primary channels: online, paper mail-in, or via a toll-free telephone interview with a live agent. Of the total respondents, 2,705 completed the survey online, 2,500 via paper questionnaire, and 188 over the phone. To ensure inclusivity, all materials were available in both English and Spanish. The AAPOR Response Rate 1 for this intensive outreach was 28%.
Chronology of the 2025 Research Cycle
The research followed a carefully orchestrated timeline to ensure high response rates and data integrity.
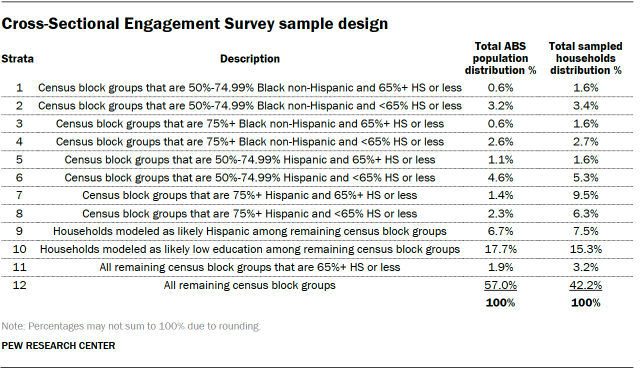
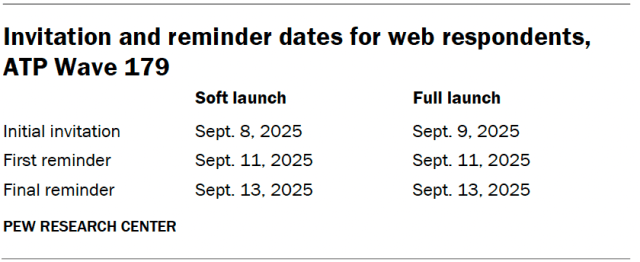
The Initial Launch: SSRS initiated the process by mailing packets to 20,751 households. These envelopes were designed to be eye-catching, featuring a 9-by-12-inch window format with $1 bills visible from the outside to encourage participation. The mailing included a URL for online access, a toll-free number, and a unique password. To manage the rollout, the survey employed a "soft launch" involving 5% of the sample, which allowed researchers to calibrate the process several days before the full national launch.
The Experimental Phase: Embedded within these mailings were two critical experiments. The first tested the efficacy of QR codes in driving digital participation, while the second analyzed the impact of varying cash incentives (one $1 bill vs. two $1 bills). These findings provide valuable insights into the "nudges" that influence survey participation in the modern age.
Follow-Up Protocols: For non-responding households, the research team escalated their efforts. After the initial digital window closed, households received a Priority Mail package containing a $5 bill, a physical paper survey, and a postage-paid return envelope. A final reminder wave, consisting of a second copy of the paper questionnaire, was sent via first-class mail to ensure every opportunity for participation was exhausted.
Supporting Data and Technical Rigor
The scientific validity of such a study rests on its weighting and design. The sample was drawn from the U.S. Postal Service Computerized Delivery Sequence File, provided by the Marketing Systems Group (MSG). This ensured that even "drop points" and rural addresses had a nonzero chance of selection, maintaining the national integrity of the data.

Weighting and Design Effects
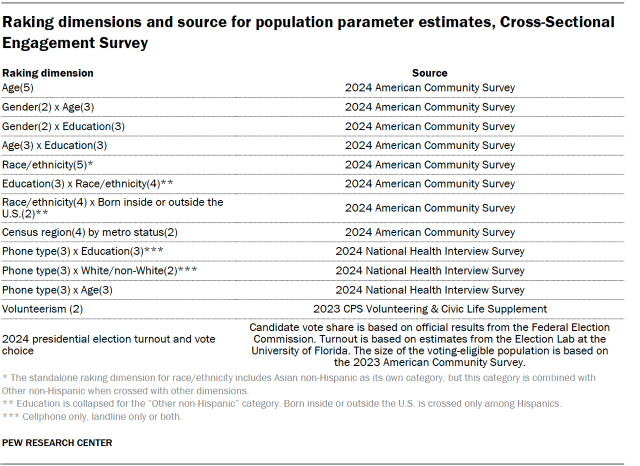
To translate the raw survey data into a reliable reflection of the U.S. population, researchers employed a multi-step weighting process. This included:
- Base Weighting: Accounting for the probability of an address being selected and the number of adults residing in the household.
- Adaptive Mode Adjustment: Correcting for potential biases introduced by the different ways (online vs. paper) respondents chose to participate.
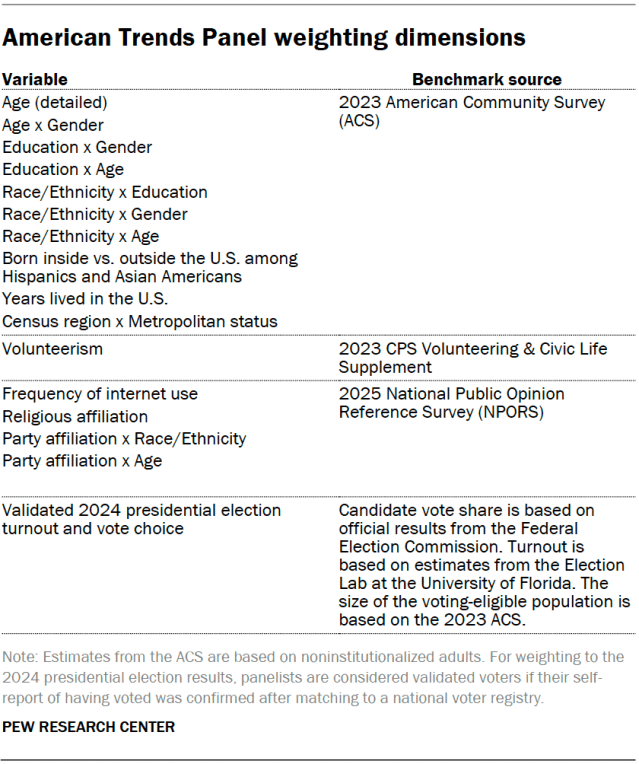
- Raking Calibration: Aligning the final dataset with official population benchmarks regarding age, gender, education, and other demographic markers.
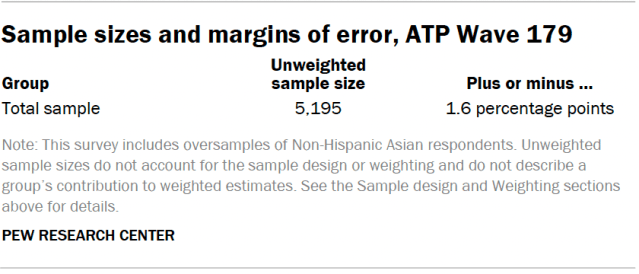
The result is a survey with a margin of error (incorporating the design effect) of approximately ±1.9 percentage points at the 95% confidence level.
The American Trends Panel (ATP) Integration
To deepen the analysis, Pew Research Center cross-referenced findings with Wave 179 of the American Trends Panel (ATP). While the Cross-Sectional Survey provided the "how" of engagement, the ATP—a nationally representative, longitudinal panel—provided the "why." By projecting engagement clusters onto the 5,195 respondents of the ATP Wave 179, researchers were able to correlate behavioral patterns with specific political attitudes and levels of civic knowledge, offering a comprehensive view of the relationship between action and belief.
Analytical Framework: Defining "Engagement"
A centerpiece of this research was the creation of four distinct "engagement groups." Rather than relying on broad categorizations, the researchers performed a cluster analysis on 19 specific behaviors. These ranged from volunteering for local charities and attending school board meetings to more digitally native actions, such as sharing news on social media or using a profile picture to signal support for a political cause.
The clustering utilized the k-medoids algorithm, a statistical method that groups individuals based on the similarity of their behavioral patterns. By treating each of the 19 behaviors as equally important, the team ensured that the resulting groups—which define the "types" of active Americans—were not biased toward any single form of participation.
Official Responses and Data Integrity
The research team at Pew and SSRS implemented rigorous data quality checks to identify "satisficing"—a phenomenon where respondents provide perfunctory answers to finish quickly. This included auditing for patterns such as choosing the first or last option in every list or leaving high numbers of questions blank. In the case of the ATP, four respondents were removed for failing to meet quality thresholds.
Furthermore, the team addressed the potential for bias in cluster analysis by running the model multiple times with different starting conditions. The fact that these models consistently returned the same results confirms the robustness of the identified engagement groups.
Implications for Future Research
The implications of the 2025 Cross-Sectional Engagement Survey are far-reaching. By successfully integrating offline (paper) and online methodologies with an experimental incentive structure, the study offers a blueprint for future public opinion research in a fragmented media environment.
The findings also challenge the assumption that civic engagement is a monolith. By categorizing citizens into behavior-based clusters, the data reveals that some individuals may be highly active in local government but disengaged from national news, while others may be purely digital activists. This granularity is essential for policymakers, non-profits, and educators who aim to strengthen democratic participation.
As the United States moves forward, the data captured in this survey will serve as a foundational reference point. It highlights that while the methods of engagement are evolving—shifting from town halls to social media feeds—the fundamental human desire to participate in the civic narrative remains a defining characteristic of the American experience. The methodological transparency demonstrated by Pew and SSRS not only validates these findings but also sets a high bar for the standards of survey research in the coming decade.